Your site goes down at 2am. Nobody notices until a customer emails at 9am asking why checkout is broken. That is the exact gap an uptime monitor closes: it pings your services from the outside on a schedule and alerts you the second one stops answering.
The hosted options (UptimeRobot, Better Stack, Pingdom) are quick to start but bill per monitor and cap the free tier fast. The self-hosted options run unlimited monitors on a $3/mo pod and keep your status-page data on a machine you own. This guide tests the 7 best uptime monitoring tools for 2026 on check interval, notification channels, status pages, and real cost. (Updated July 2026.)
How I compared these: feature sets and check intervals come from each tool’s own docs; every price and free-tier limit was checked against the vendor’s own pricing page in July 2026. Self-hosted tools are free software, so the only cost is the small server they run on.
At a Glance: Which Uptime Monitor to Pick
Short on time? Here is the verdict before the details.
- Self-hosted default: Uptime Kuma. Unlimited monitors, checks down to 20 seconds, 90+ notification channels, and a built-in status page. One-click $3/mo deploy on InstaPods.
- Config-as-code / GitOps: Gatus. Every health check lives in one YAML file you keep in Git, and it renders a status page from it.
- Cron and backup jobs: Healthchecks. A dead-man’s-switch that alerts you when a scheduled job stops pinging, which HTTP monitors cannot catch.
- Fastest hosted start (free): UptimeRobot. Free for 50 monitors at 5-minute checks, no server to run.
- Hosted with incident management: Better Stack. On-call scheduling and escalation on top of uptime checks, from about $29/mo.
Short version: most self-hosters should run Uptime Kuma and add Healthchecks for cron jobs. Reach for a hosted tool only when you want someone else to own the monitoring server. The rest of this guide tests each one.
Why Self-Hosted Uptime Monitoring Beats SaaS for Most People
Hosted uptime tools are priced per monitor, and the free tiers run out quickly. UptimeRobot’s free plan covers 50 monitors at a 5-minute interval; Better Stack’s free tier is 10 monitors; Pingdom’s Synthetic monitoring starts at $18/mo, or $16.50/mo billed annually, for 10 uptime checks, and the price climbs with the check count. Add a status page, faster intervals, or SMS alerts and you climb into real money for what is a simple HTTP request on a timer.
A self-hosted monitor flips that. Uptime Kuma runs as many monitors as your pod can handle at 20-second intervals, with status pages and 90+ notification integrations, for a flat $3/mo on InstaPods no matter how many endpoints you watch. Your uptime history and status-page data stay on a server you control instead of a third-party SaaS.
The old way to run one yourself was the pain: provision a server, install the runtime, configure nginx, set up SSL, open the firewall, add a process manager, and point a domain at it. That is the friction InstaPods removes: an instant launch with the domain, SSL, and process management already handled. If you are new to running your own apps, the self-hosted apps directory is a good starting point.
Uptime Kuma: The Self-Hosted Default
Uptime Kuma (now on its 2.x line) is the tool most self-hosters reach for first. It monitors whether your services are reachable: HTTP, TCP, DNS, ping, Docker, gRPC, MQTT, Steam game servers, and more. If it has an endpoint, Uptime Kuma can watch it.
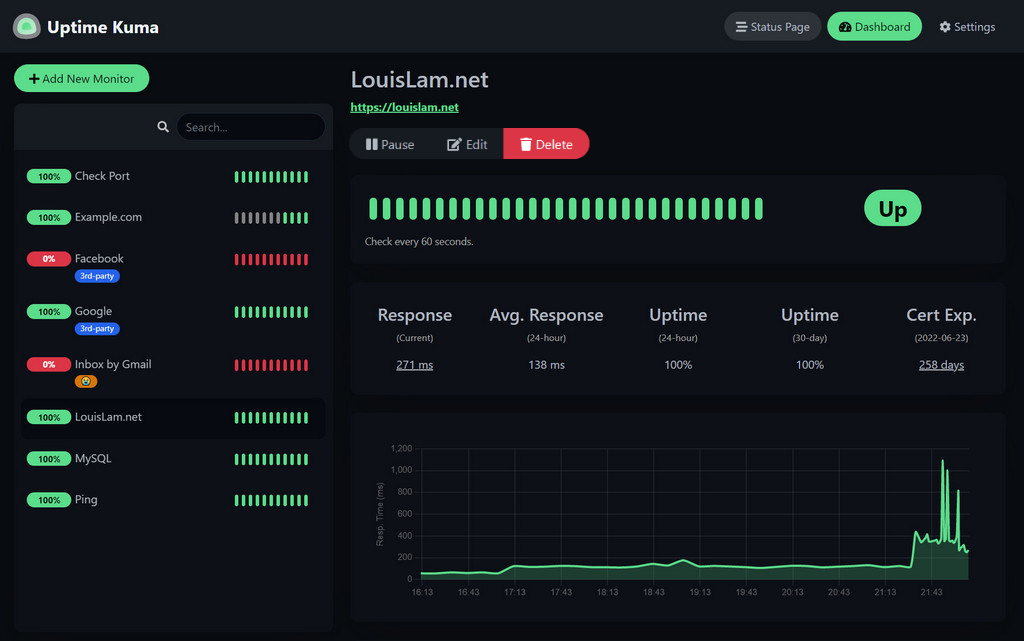 The Uptime Kuma dashboard: per-monitor up/down status, uptime percentage, and response times at a glance. (Screenshot: Uptime Kuma project.)
Why it’s popular: unlimited monitors, check intervals down to 20 seconds, 90+ notification channels (Telegram, Discord, Slack, email, ntfy, Gotify, webhooks, and dozens more), SSL certificate expiry monitoring, and maintenance windows so planned downtime does not page you. It uses about 30-50MB of RAM at rest, closer to 60-80MB once you are running 20-30 monitors.
Setup time: under 5 minutes. Running it manually means a Node app plus SQLite plus a reverse proxy for SSL; on InstaPods it is a one-click $3/mo deploy with the domain and certificate already wired up.
Status pages: built in and customizable. You can publish a public page at your own domain that shows the live status of each service, with incident history and a custom logo. This is the feature people most often pay a hosted tool for, and Uptime Kuma includes it.
What it doesn’t do: Uptime Kuma checks availability from the outside, so it does not tell you why something is down. It will not show CPU, memory, or disk graphs, that is a resource monitor’s job. Pair it with a lightweight metrics tool (see the section below) for the full picture. It also runs from a single location by default, so for true multi-region checks you would run more than one instance. If you are weighing it against a heavier stack, we have written up Uptime Kuma vs Prometheus, vs Zabbix, vs Nagios, vs Netdata and vs Grafana Synthetic Monitoring.
Best for: anyone who needs to know the instant a website, API, or service goes down, and wants a status page without a monthly per-monitor bill. Deploy Uptime Kuma on InstaPods in one click for $3/mo. If you would rather someone else ran it entirely, managed Uptime Kuma hosting prices all nine providers that offer it, from $2.80/mo to $499/year.
Gatus: The Config-as-Code Alternative
Gatus answers the same “is my service reachable” question as Uptime Kuma, but for people who would rather define monitoring in version control than click through a UI.
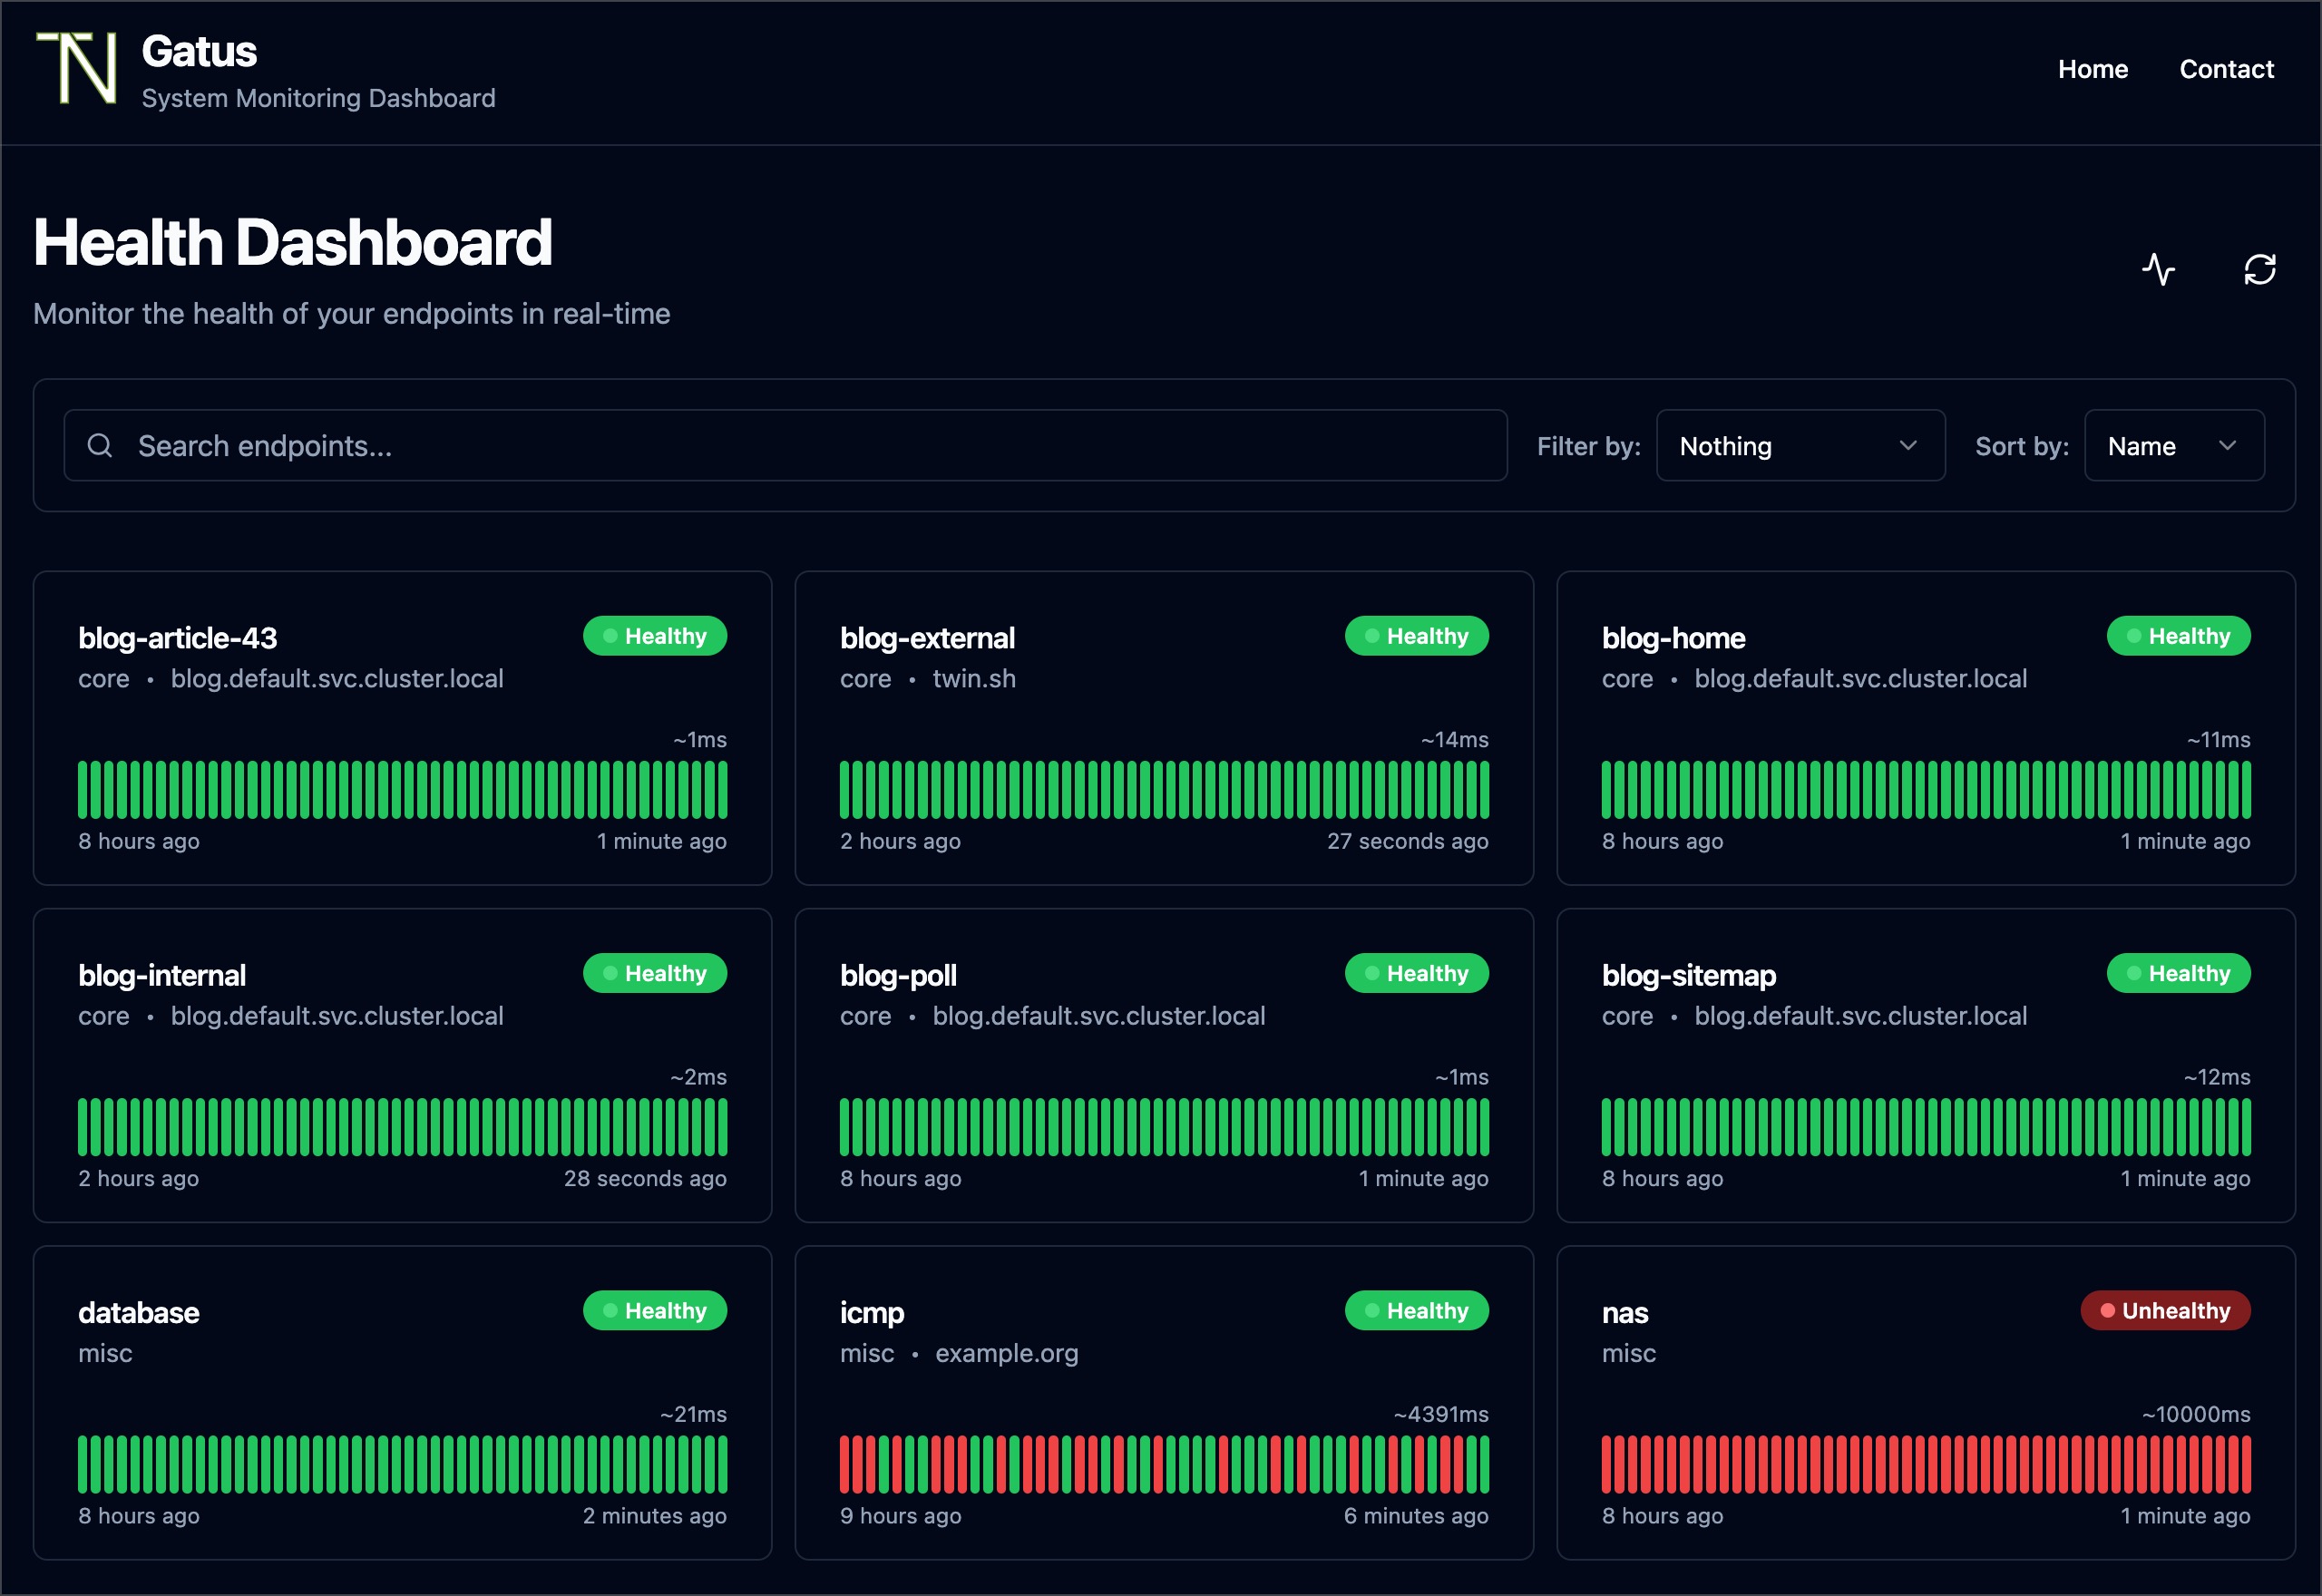 The Gatus dashboard, rendered entirely from a YAML config file: each service shows its recent check history and response time. (Screenshot: Gatus project.)
What makes it different: every health check (HTTP, TCP, ICMP, DNS, SSH, TLS, and more) is declared in a single YAML file you keep in Git. Change a check, commit it, redeploy. It renders a status page from that config and supports conditions like response time thresholds and specific status codes. It is a single Go binary (Apache-2.0) using roughly 10-40MB of RAM, lighter than Uptime Kuma’s Node app.
The trade-off: no point-and-click editing. Adding a monitor means editing YAML, which is a feature if you want reproducible, reviewable config and a friction point if you just want to add a URL quickly. Notification integrations are fewer than Uptime Kuma’s 90+, though the common ones (Slack, Discord, Telegram, PagerDuty, email, webhooks) are covered.
Best for: teams that treat infrastructure as code and want their monitoring config reviewed in pull requests alongside everything else. If you are weighing the two directly, Gatus vs Uptime Kuma goes through the condition language, the storage default that catches people out, and where each one actually fits.
Healthchecks: The Dead-Man’s-Switch for Cron Jobs
Healthchecks (the self-hosted version of Healthchecks.io) monitors a category the others miss: scheduled jobs. HTTP monitors tell you when a service is up. They cannot tell you that last night’s database backup silently failed to run. We compare the two directions head to head in Uptime Kuma vs Healthchecks.
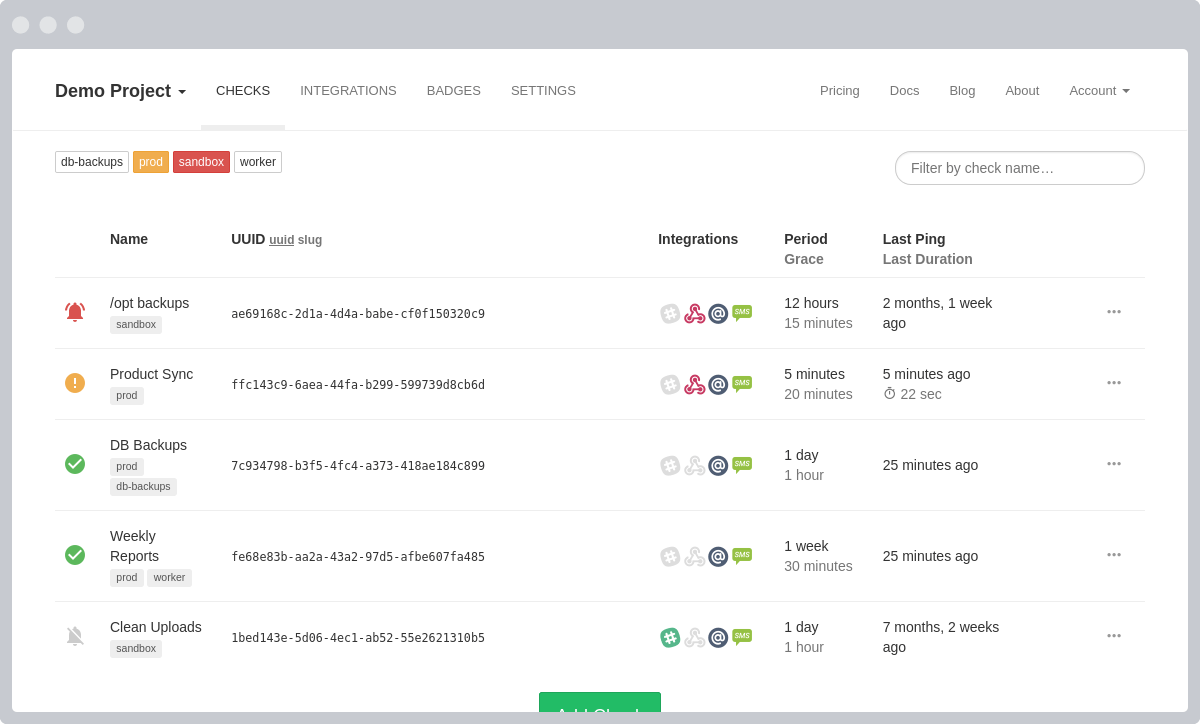 The Healthchecks “My Checks” view: each cron or backup job shows when it last pinged and whether it is overdue. (Screenshot: Healthchecks project.)
How it works: each job pings a unique URL when it finishes successfully. If a ping does not arrive within the window you set, Healthchecks alerts you. It is the “did my nightly backup actually run?” safety net, and it works for cron jobs, systemd timers, Kubernetes CronJobs, and any script that can make an HTTP request on success.
What it monitors: cron schedules, backup jobs, batch pipelines, certificate renewals, anything that runs on a timer and should complete. It ships a clean dashboard, supports the same broad set of notification channels, and is a Django app (BSD-licensed).
Best for: running alongside Uptime Kuma. Uptime Kuma watches your live endpoints; Healthchecks watches your background jobs. Together they cover both “is the site up” and “did the job run.”
UptimeRobot: The Fastest Hosted Start
UptimeRobot is the hosted incumbent, and the free tier is why most people start here. No server to run: sign up, paste a URL, done.
The free tier: 50 monitors at a 5-minute check interval, with email alerts and a basic status page. That is genuinely useful for a personal project or a small site.
The limits: the 5-minute interval means up to 5 minutes of downtime before you are alerted, and faster 1-minute checks, more monitors, SMS alerts, and multiple status pages move you onto a paid plan (their Solo tier and up). Because it is hosted, your monitoring data lives on UptimeRobot’s servers, and you are watching your infrastructure from their locations, not yours. Always check their pricing page for current tiers, as the plans have been revised more than once.
Best for: people who want zero setup and are fine with 5-minute checks and a cap on the free plan. If you outgrow it, self-hosting Uptime Kuma removes both the monitor cap and the interval limit. UptimeRobot vs Uptime Kuma is the full head-to-head, with every current tier priced out and the two places UptimeRobot genuinely wins.
Better Stack: Hosted With Incident Management
Better Stack (formerly Better Uptime) is the hosted option for teams that want on-call scheduling on top of uptime checks. It combines monitoring, incident management, status pages, and log management in one product.
What you get: uptime checks with fast intervals, on-call rotations and escalation policies, phone and SMS alerting, and polished hosted status pages. The free tier covers about 10 monitors; paid plans start around $29/mo and climb with team size and features.
The trade-off: it is the most expensive tool in this guide, and it is hosted, so your data and status pages live on Better Stack. The incident-management features are genuinely useful for a team with a real on-call rotation, and overkill for a solo self-hoster who just needs an alert when a site goes down.
Best for: teams that need PagerDuty-style on-call scheduling bundled with their uptime monitoring and are happy to pay for a hosted service.
Kener and Statping-ng: Status-Page-First Options
If a good-looking public status page is your main goal, two self-hosted tools lead with that.
Kener is a modern, SvelteKit-based status page with monitoring built in. It focuses on a polished, customizable public page (themes, incident timelines, custom domains) backed by HTTP and TCP checks, and it is a good fit when the status page is the product you are shipping to users.
Statping-ng is the community-maintained continuation of the original Statping project. It bundles monitors, a status page, and notifications into a single Go binary with a built-in web UI, and it can export a static status page. Development is community-driven, so check recent release activity before committing to it for anything critical.
Best for: projects where the public status page matters as much as the alerting. For most people, Uptime Kuma’s built-in status page is enough and keeps everything in one tool.
Don’t Forget Notifications and the Resource Side
Two things round out any uptime setup.
Notifications: every tool here can email you, but email is easy to miss. Route alerts through a lightweight self-hosted notification server like ntfy (about 20MB, HTTP-native, with iOS and Android apps and UnifiedPush support) or Gotify, so a downtime alert becomes a push notification you actually see. Uptime Kuma, Gatus, and Healthchecks all support both.
The resource side: an uptime monitor tells you if a service is reachable, not why it went down. A server pegged at 100% CPU or out of disk will start returning 502s, and only a resource monitor catches that before it happens. Pair your uptime tool with a lightweight metrics tool like Beszel (a roughly 10-15MB agent). The two do not overlap: one watches availability from outside, the other watches resources from inside. See the best server monitoring tools guide for the resource side, and Beszel vs Uptime Kuma for why most self-hosters run both.
Which Uptime Monitoring Tool Should You Choose?
Here is the decision tree:
- Want the self-hosted default? Uptime Kuma. Unlimited monitors, 20-second checks, status pages, 90+ notification channels, $3/mo on InstaPods.
- Prefer config in Git? Gatus. Define every check in YAML and review it in pull requests.
- Monitoring cron and backup jobs? Add Healthchecks. It catches the silent job failure that HTTP monitors miss.
- Want zero setup and 5-minute checks are fine? UptimeRobot’s free tier, capped at 50 monitors.
- Need team on-call scheduling? Better Stack, from about $29/mo, hosted.
- Status page is the point? Kener or Statping-ng, or just use Uptime Kuma’s built-in one.
For most self-hosters, start with Uptime Kuma and add Healthchecks for your scheduled jobs. That combination covers live endpoints and background jobs for $3/mo, versus a hosted tool that bills per monitor.
Uptime Monitoring Tools Compared
| Tool | Hosting | Monitors | Min interval | Status page | Cost |
|---|---|---|---|---|---|
| Uptime Kuma | Self-hosted | Unlimited | 20 seconds | Built-in | $3/mo (server) |
| Gatus | Self-hosted | Unlimited (YAML) | Config-defined | Built-in | $3/mo (server) |
| Healthchecks | Self-hosted | Unlimited | Cron-based | No (job dashboard) | $3/mo (server) |
| Kener | Self-hosted | Unlimited | Config-defined | Status-page-first | $3/mo (server) |
| Statping-ng | Self-hosted | Unlimited | Config-defined | Built-in | $3/mo (server) |
| UptimeRobot | Hosted SaaS | 50 (free) | 5 min (free) | Basic | Free / paid tiers |
| Better Stack | Hosted SaaS | ~10 (free) | Fast (paid) | Hosted, polished | Free / from ~$29/mo |
Every self-hosted tool above keeps your uptime history and status-page data on a machine you control. The hosted tools are faster to start but bill per monitor and store your data on their servers. For a fleet of personal projects or a small business, unlimited monitors at 20-second checks for a flat $3/mo is hard to beat.
Deploy Uptime Kuma on InstaPods - one click, $3/mo, monitoring in 5 minutes.
FAQ
What is the best self-hosted uptime monitoring tool?
Uptime Kuma is the most popular self-hosted uptime monitor in 2026. It runs unlimited monitors at check intervals down to 20 seconds, supports 90+ notification channels, includes a customizable status page, and uses about 30-50MB of RAM. It monitors HTTP, TCP, DNS, ping, Docker, gRPC, and MQTT endpoints. On InstaPods it deploys in one click for $3/mo with the domain and SSL already configured.
Uptime Kuma vs UptimeRobot: which should I use?
Choose UptimeRobot if you want no server to manage and 5-minute checks are fine. Choose Uptime Kuma if you want unlimited monitors, 20-second checks and data ownership for a flat $3/mo. The tier-by-tier breakdown, including multi-region probing, which is the one thing a single Uptime Kuma instance cannot do, is in UptimeRobot vs Uptime Kuma.
Can I get a free uptime monitor?
Yes, two ways. UptimeRobot’s hosted free tier covers 50 monitors at a 5-minute interval with no server to run. Or self-host Uptime Kuma, which is free open-source software with unlimited monitors; the only cost is the server it runs on, which is $3/mo on InstaPods. Self-hosting also removes the monitor cap and the interval limit.
What is the difference between uptime monitoring and server monitoring?
Uptime monitoring checks whether a service is reachable from the outside (HTTP, TCP, ping, SSL) and answers “is my site up.” Server monitoring watches resources from inside the machine (CPU, memory, disk, network) and answers “is my server healthy.” They do not overlap: a server at 10% CPU is meaningless if your site is returning 502s. Most self-hosters run both, for example Uptime Kuma for availability and Beszel for resources.
How do I monitor cron jobs and backups?
Use a dead-man’s-switch monitor like the self-hosted Healthchecks. Each job pings a unique URL when it finishes successfully, and if the ping does not arrive within the expected window, Healthchecks alerts you. This catches the silent failure that HTTP uptime monitors cannot see, such as a nightly backup that never ran. It works for cron jobs, systemd timers, and Kubernetes CronJobs.
Does Uptime Kuma include a status page?
Yes. Uptime Kuma ships a built-in, customizable status page you can publish at your own domain, with per-service status, incident history, and a custom logo. This is the feature people most often pay a hosted tool for, and Uptime Kuma includes it at no extra cost beyond the server it runs on.
Related reading:
- The 7 Best Server Monitoring Tools - the resource side (CPU, memory, disk) that pairs with uptime monitoring
- Beszel vs Uptime Kuma - server metrics vs endpoint uptime, and why you want both
- Uptime Kuma vs UptimeRobot - self-hosted vs the free-tier hosted incumbent
- Uptime Kuma vs Better Stack - unlimited monitors vs hosted on-call and incident management
- Uptime Kuma vs Pingdom - $3/mo self-hosted vs per-monitor SaaS pricing
- Gatus vs Uptime Kuma - YAML config you keep in Git vs a clickable web UI
- Uptime Kuma vs Checkmk - an endpoint prober and status page vs a full fleet monitoring server
- Deploy Uptime Kuma on InstaPods - one-click $3/mo availability monitoring and status pages
- Hosting With No Bandwidth Charges - flat $3/mo pricing with no surprise bills
- Deploy Without DevOps - get apps running without server management